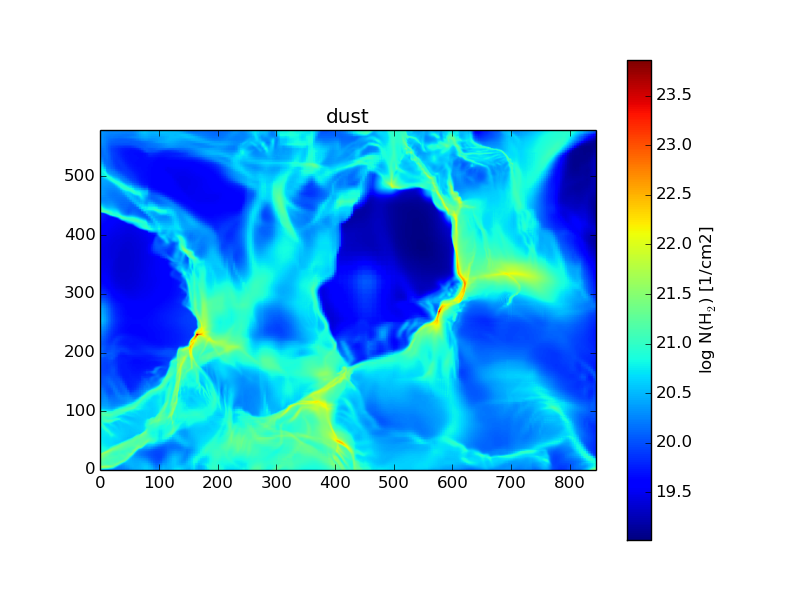
Synthetic Column Density Map Based on Dust
We compare synthetic observations of dust emission and several molecular line tracers (for example $^{12}$CO, $^{13}$CO and HI) using zoom-in simulations of molecular cloud formation. We use the SILCC zoom-in simulations presented in Seifried et al. (2017) and new simulations including magnetic fields presented in Seifried et al. (2018). These simulations connect, for the first time simultaneously, the larger scale environment, chemical network, self-gravity and high spatial resolution. The formation of molecular clouds is simulated together with their surroundings, providing more realistic initial conditions for cloud formation than just using an isolated box. The chemical components of the gas are coupled together and simulated simultaneously with the cloud dynamics. The zoom-in simulations reach a resolution of approximately 0.1 pc, showing also the evolution of filamentary structures within the clouds. These simulations give a realistic starting point for making synthetic observations of cloud evolution from large scale structures to molecular cloud and filament scales, and comparing to real observations using several tracers. This enables us to compare, for example, the differences between cloud structures as revealed by different tracers, and their correlation. As an example, the above figure shows a synthetic column density map based on dust emission. We also study the velocity structure of the cloud based on the synthetic line data.